Most email teams have no shortage of data. Open rates, click rates, bounce counts, revenue per send. What they’re usually missing isn’t more data, it’s the right data: the signals that explain why those numbers look the way they do.
A low open rate could mean your subject line missed. Or it could mean 30% of your Gmail recipients never saw the email because it landed in spam. Those are completely different problems with completely different fixes. Your ESP dashboard can’t tell them apart.
An email deliverability dashboard is built for the second question. Not what happened with your content, but whether your email was ever given a fair chance to reach the inbox in the first place. Here’s what it needs to show, and why each signal matters.
What an ESP Dashboard Shows vs. What a Deliverability Dashboard Shows
It’s worth being clear on this distinction because the two are often confused.
Your ESP dashboard (Klaviyo, Mailchimp, Omnisend) reports on recipient behaviour after the email was accepted by a mail server. Opens, clicks, bounces, unsubscribes, complaint counts. These are engagement metrics. They’re useful for understanding how your audience responds to your content, but they have a fundamental blind spot: they only capture data from recipients who could see your email. The people whose emails landed in spam aren’t opening anything. Their non-engagement is invisible.
A deliverability dashboard reports on what happened at the mailbox provider level: where the email landed, what your domain’s reputation looks like to Gmail and Yahoo, whether your authentication is passing, and whether your complaint rates are approaching dangerous thresholds. These are infrastructure signals. They explain why your engagement metrics look the way they do.
One way to think about it: your ESP dashboard tells you how your email performed. Your deliverability dashboard tells you whether your email was given a fair chance to perform.
The Signals a Deliverability Dashboard Must Show
1. Inbox Placement by Provider
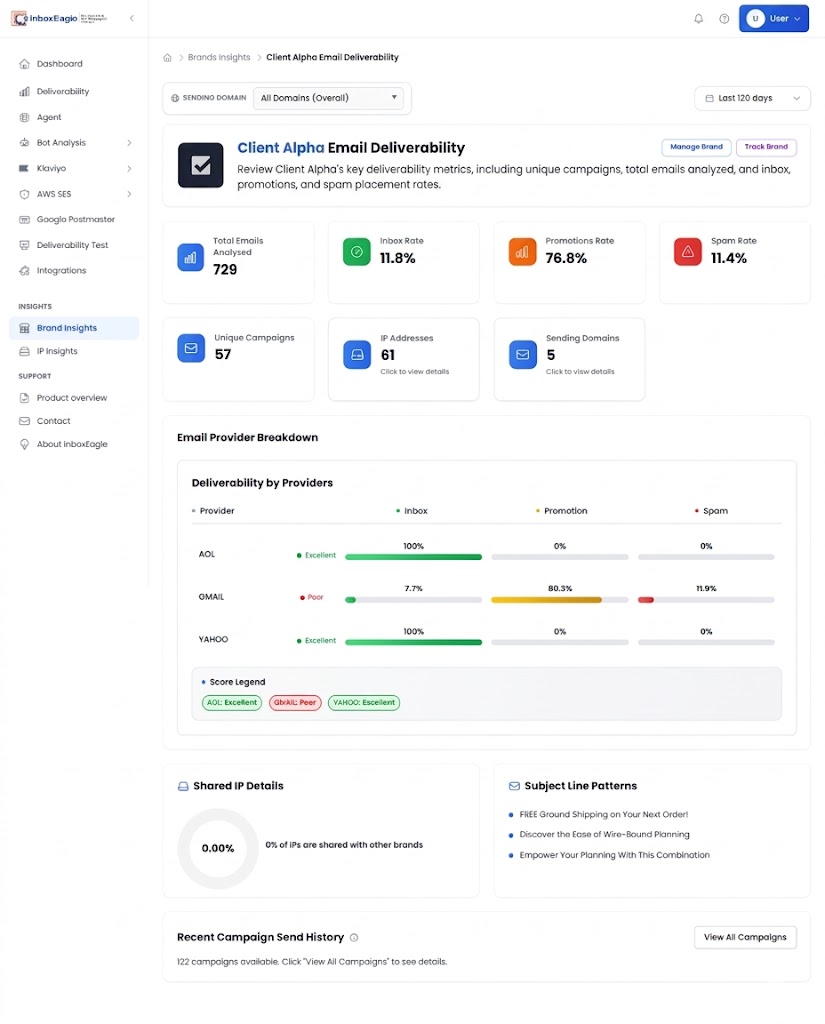
This is the foundation. For every campaign you send, a deliverability dashboard should show the percentage of emails that landed in the inbox, the promotions tab, and the spam folder, broken down at each major mailbox provider: Gmail, Yahoo, and AOL separately.
The provider breakdown matters because placement problems are almost always provider-specific. A Gmail spam issue and a Yahoo spam issue have different causes and different fixes. Seeing an aggregate “78% inbox rate” doesn’t tell you whether it’s Gmail dragging you down or Yahoo. Seeing “Gmail: 71% inbox, Yahoo: 96% inbox” tells you exactly where to look.
InboxEagle shows this breakdown for every campaign in the Deliverability view, alongside the sending domain, sending IP, subject line used, and the timestamp when the email was received at each provider.
2. Campaign Performance Score
Raw placement percentages tell you the outcome. A performance score gives you a single comparable number across campaigns so you can spot trends without manually reviewing percentages every time.
InboxEagle scores each campaign out of 100, factoring in placement results, authentication pass rates, and engagement signals. The score is most useful as a trend signal. A campaign scoring 87 in isolation is fine. A program where scores have dropped from 87 to 81 to 74 to 68 over the last eight campaigns is a program with a problem that needs to be investigated before it becomes a crisis.
3. Gmail Domain Reputation (Google Postmaster Tools)
Gmail is the dominant mailbox provider for most eCommerce audiences. Its placement decisions are heavily influenced by your domain reputation as Gmail sees it, which is separate from your IP reputation or your ESP’s sending infrastructure.
Google Postmaster Tools reports this reputation in four levels: High, Medium, Low, and Bad. High means Gmail trusts your domain and routes your email to the inbox. Bad means Gmail is actively filtering your mail to spam. Medium and Low are warning zones where inbox placement is degraded but not yet catastrophic. Google’s Postmaster Tools documentation describes each level and what triggers the classification.
A deliverability dashboard should surface this reputation level alongside your campaign data. InboxEagle pulls Google Postmaster Tools data in real time and shows your Gmail domain reputation score, spam rate trend, authentication pass rates as Gmail sees them, and delivery error categories, all in one view, updated in real time with alerts firing within 1 minute of any drop.
Without this data, you can see that your Gmail placement is low but you can’t tell whether the cause is a content issue, a complaint rate problem, an authentication failure, or a volume spike. Postmaster Tools data closes that gap.
4. Gmail Spam Rate
Gmail publishes your spam rate: the percentage of your emails that Gmail users are marking as spam. Google’s sender guidelines set clear thresholds: keep spam rate below 0.10% to maintain inbox placement, and above 0.30% the impact on deliverability is severe and sustained.
This number is not available in Klaviyo. It only appears in Google Postmaster Tools. A deliverability dashboard that pulls from Postmaster Tools surfaces this rate per day, tracks it against those thresholds, and alerts you before you breach them rather than after.
The most common pattern: a brand’s spam rate quietly creeps from 0.05% to 0.09% to 0.13% over several weeks of sends to a stale segment. No individual send triggers an alarm. But the trend is a slow-motion deliverability problem that will eventually show up as a Gmail reputation drop, then a placement drop, then a revenue drop. The dashboard catches it at the 0.09% stage, not after the damage is done.
5. Yahoo Complaint Rate
Yahoo operates its own complaint rate system through Yahoo Sender Hub, separate from Gmail’s Postmaster Tools. Yahoo’s threshold is also 0.10%. Above that, Yahoo starts throttling and filtering your sends.
A deliverability dashboard should show your Yahoo complaint rate in real time, tracked against green (safe), amber (warning), and red (critical) zones. InboxEagle monitors this through the Yahoo Sender Hub integration and alerts you as soon as your rate enters the amber zone, before you reach Yahoo’s enforcement threshold.
Yahoo complaint problems often trace back to specific campaigns or list segments. A dashboard that shows complaint rate trends alongside your campaign history lets you correlate a spike back to the exact send that caused it.
6. SPF, DKIM, and DMARC Authentication Results
Authentication pass rates should be visible per campaign, not just at the domain level. Seeing that DMARC is configured is different from seeing that DMARC passed on every campaign you sent this month.
For each campaign, a deliverability dashboard should show whether SPF, DKIM, and DMARC passed or failed, and if they failed, the specific failure reason. InboxEagle surfaces these results in the campaign Deliverability view alongside placement data, so you can see immediately whether an authentication failure correlates with a placement problem on the same send.
DMARC monitoring specifically should also show policy progression: are you on p=none, p=quarantine, or p=reject? And are there unauthorized senders using your domain that your DMARC reports are surfacing? InboxEagle parses DMARC aggregate reports automatically and shows you every IP and sending service sending mail on behalf of your domain, authorized or not.
7. Bot Detection
This one affects the accuracy of every other signal on your dashboard.
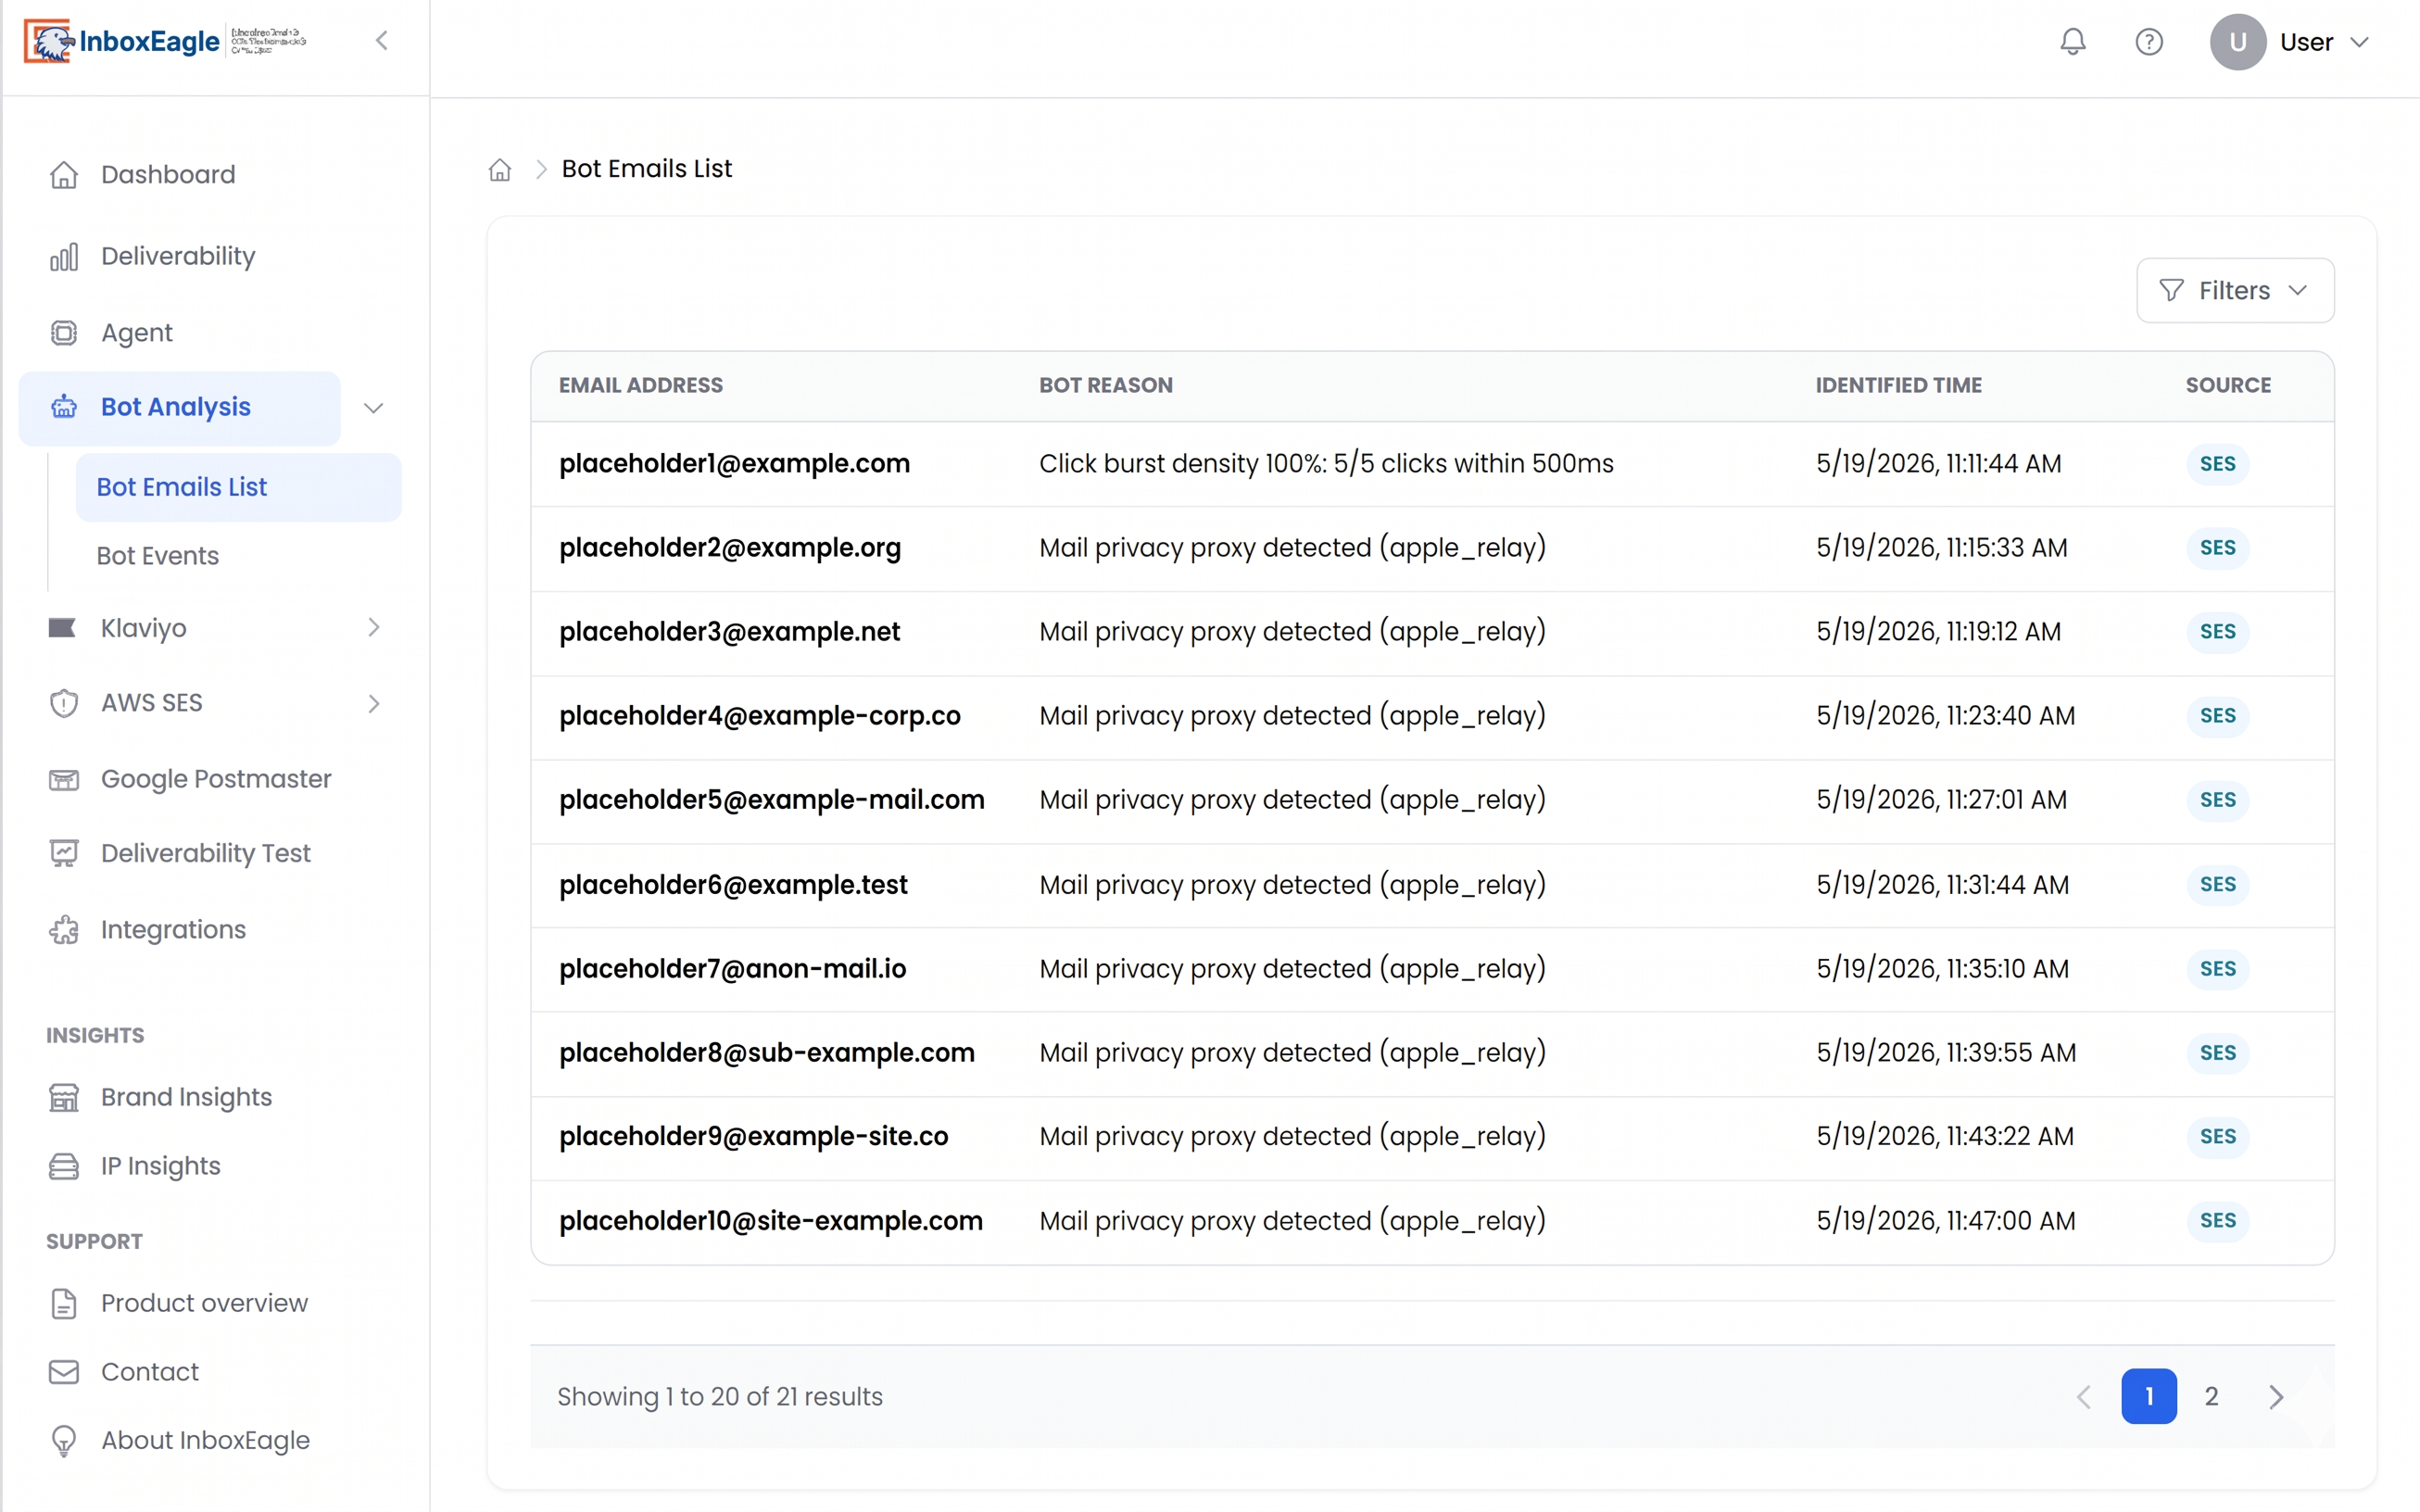
Bots sign up to email lists and their activity patterns look like engagement. They open emails, sometimes click. This inflates your open rate in Klaviyo and distorts the engagement signals you use to make decisions about segmentation, re-engagement, and list suppression. More directly, bot-triggered opens inflate the denominator in engagement rate calculations, making your real engagement look weaker than it is.
InboxEagle’s Bot Analysis identifies which addresses in your list are bots based on their activity patterns. The Bot Emails List shows you exactly which addresses are flagged for suppression. Removing them has two effects: your engagement metrics become more accurate, and your Klaviyo contact count goes down, which is a direct cost reduction.
8. Multi-Brand or Multi-Domain View
For agencies managing multiple clients, or eCommerce operators running more than one store, a deliverability dashboard needs to show program health across all brands simultaneously, not just one at a time.
InboxEagle’s Manage Brands section shows every brand you’re monitoring with its own metrics: campaigns sent, top-performing campaigns, average performance score, and best campaigns. When a client’s score drops or a campaign shows elevated spam placement, you click into their view and have the full diagnostic picture available immediately.
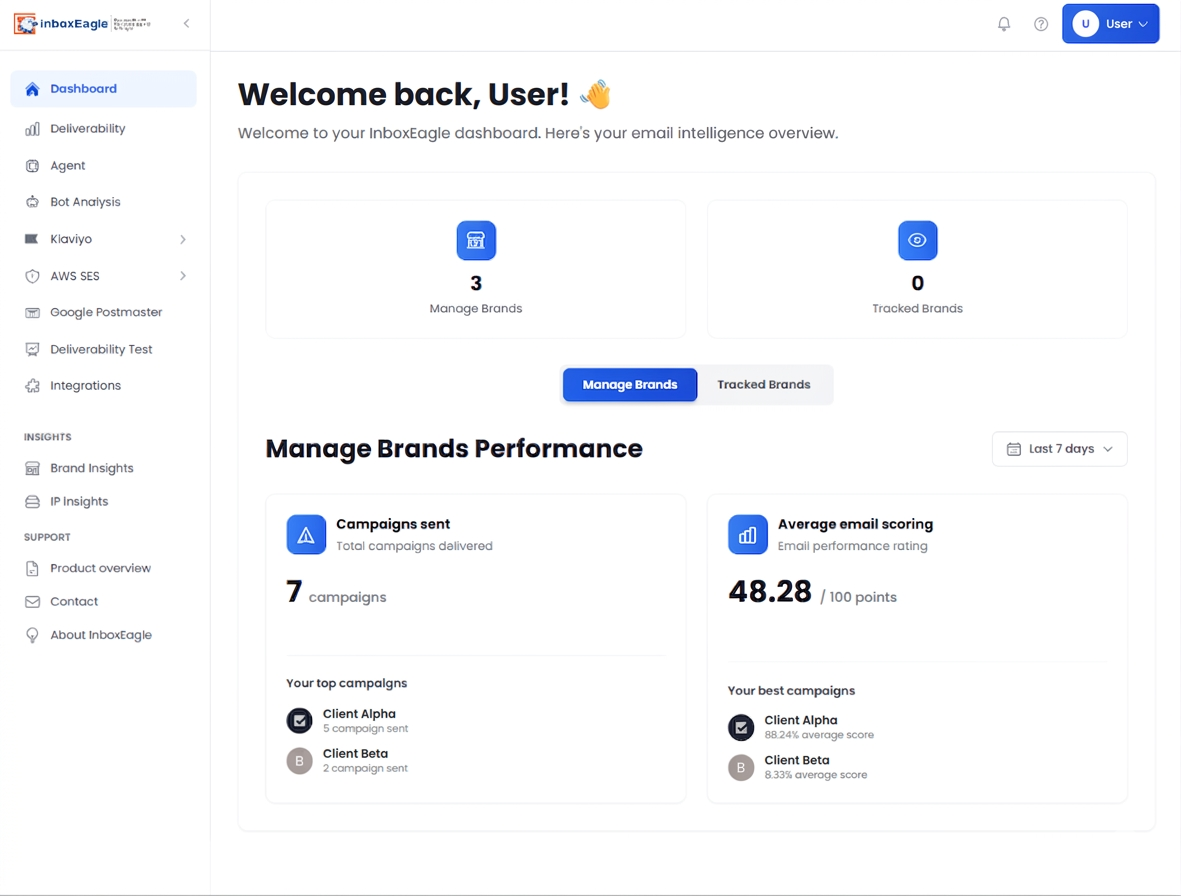
The Tracked Brands feature extends this further: you can follow competitor brands and see their campaign insights, useful for benchmarking your placement and performance against others in your category.
What Most Deliverability Dashboards Get Wrong
Most tools in this space give you one layer but not both. They’re either ESP-adjacent (showing engagement data with a few delivery metrics bolted on) or infrastructure-focused (showing domain reputation and authentication but no campaign-level placement data).
The diagnostic value comes from having both in the same view. If your Gmail placement drops on a specific campaign, you need to see the placement result, the authentication result for that send, and the Postmaster Tools reputation data for the same date window, simultaneously. If those three data sources live in three different tools, the investigation takes an hour. In a unified dashboard, it takes two minutes.
The other common gap is freshness. Postmaster Tools data that’s 24 hours stale means you discover a complaint rate problem after it has already affected a full day of sends. InboxEagle pulls Postmaster Tools data in real time and fires alerts within 1 minute of any threshold breach.
What to Look for When You First Connect
When you connect your domain to InboxEagle for the first time, the most common findings are:
A provider-specific placement gap. Gmail placement is at 74% while Yahoo is at 93%. This is almost always a Gmail reputation or complaint rate issue, and it’s diagnosable immediately in the Postmaster Tools view.
An authentication failure on live sends. DMARC is configured but failing on some campaigns due to alignment issues. The campaigns look fine in Klaviyo but are being filtered at Gmail.
A spam rate creep that hasn’t hit the threshold yet. The Gmail spam rate is at 0.08%, which is below Google’s 0.10% advisory but trending up. Catching this before it crosses the threshold is the difference between a proactive fix and an emergency.
Bots inflating list size and engagement metrics. A meaningful percentage of a list turns out to be bot addresses, which means the Klaviyo bill is higher than it should be and the engagement data being used for segmentation decisions is partially artificial.
None of these show up in an ESP dashboard. All of them are visible within the first campaign cycle on InboxEagle.
Getting Started
A deliverability dashboard is only useful if it’s active when something goes wrong, not connected after. The value is in the history and the trend data, which only accumulates over campaigns.
Connect your sending domain, integrate Klaviyo via the Klaviyo InboxEagle integration, and link Google Postmaster Tools for Gmail reputation data. From your next send, every campaign is scored, every placement result is recorded, and every reputation signal is tracked. The dashboard starts telling you things your ESP never could.
If you’re new to how placement monitoring works, how to check if your emails are landing in spam covers the fundamentals. For a deeper look at seed list testing vs. real-world monitoring, see seed list testing vs. real-world inbox monitoring.
Create a free InboxEagle account at app.inboxeagle.com/register and have your deliverability dashboard live before your next campaign.
Note: Content created with the help of AI and human-edited and fact-checked to avoid AI hallucinations.